
Considering the temptation of NESF
A tidy 12% yield from Next Energy Solar - is this an OB2025 idea?


Dear reader
I previously wrote in my article “what’s occurring”:
NESF might not be everyone's cup of tea but at the end of the day when all's said and done, is it tidy?
NESF is another FTSE250 company potentially for my ideas for 2025. The second of four FTSE250 companies in the OB 25 Ideas for 25. Don’t worry reader, I’ve not entirely turned my back on nano caps. Having started a list of 20 I was agonising over further ideas I felt carried merit. So I decided since the next year is (20)25 that the idea for OB 25 ideas for 25 had a nice ring to it. More for you to read, reader. More opportunities for harrumphers to harrumph about things. More for eagle-eyed readers to use along with their skill and timing to turn ideas into profitable outcomes.
And learning from fellow racer, Mr Arby, I’ve furthermore decided that one of these ideas will be weighted. More on that in a future article.
Next Energy Solar
NESF is a large solar investment trust with 102 assets and capacity of 983MW. After years of trading at a premium to NAV, both its NAV and share price have fallen away, albeit its NAV has reverted to 2021 levels - do we see a clue there that temporary factors created “noise” which increased and then decreased its assets?
Yes.

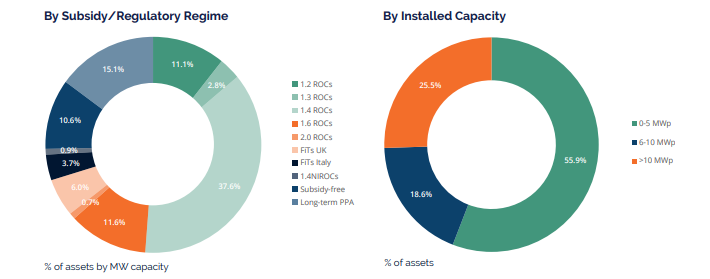
NESF has a large UK footprint, with 10% Italy, and 5% RoW. Its assets are long life, and 983MW capacity and 599GWh generated in 2023 tells us that the energy yield was 7.3% of capacity, while in 2022 the energy yield was 9.1% (599000/(933*365*24)). The yield fell to just 6.9% in 1H25
The yield was spot on to the average based on our world in data (you can click on the chart below). It reveals that capacity and generation are fairly consistent between countries. I had wrongly assumed that yield for the UK was lower than say Italy or the Sahara Desert, but the data doesn’t show that. So 85% of solar being in the UK isn’t the disadvantage I’d first imagined it would be. At least not using today’s technology.

The answer to this apparent riddle/contradiction is a lower temperature offsets lower irradiance. While more irradiance means more power, more heat shortens the life of equipment and reduces the efficiency of solar too. That factoid gobsmacked me.
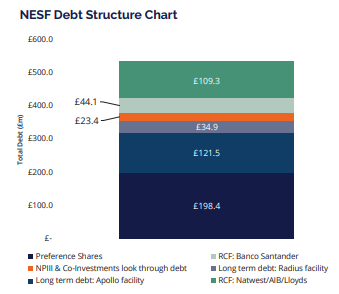
NESF appears to have a large portfolio of assets, with low costs of debt (70% fixed and 30% floating but on very advantageous rates of SONIA + 1.2% and +1.5%) and using asset sales to reduce the more expensive RCF debt. £21.8m of short-term RCF was paid down in the period to 30/09/24.
Revenue has a degree of protection from price fluctuations through hedging, ROC (renewable obligation certificates) and subsidies. About 90% of capacity is subsidised, so power prices alone only apply to 10%. Its 50MW of energy storage is live (70% owned) and 250MW is pre-construction
As at 30/9/24 NESF had agreed fixed UK pricing (hedged) covering 94.4% of budgeted generation for the 2024/25 financial year, 81% of budgeted generation for the 2025/26 financial year and 69% for the 2026/27 financial year, 62% for 2027/208 and 61% for 2028/2029.
Income in the September 2024 interim covers dividends 1.5X NESF proudly proclaim.
Show me the money the OB says. Read on to find out what I found.
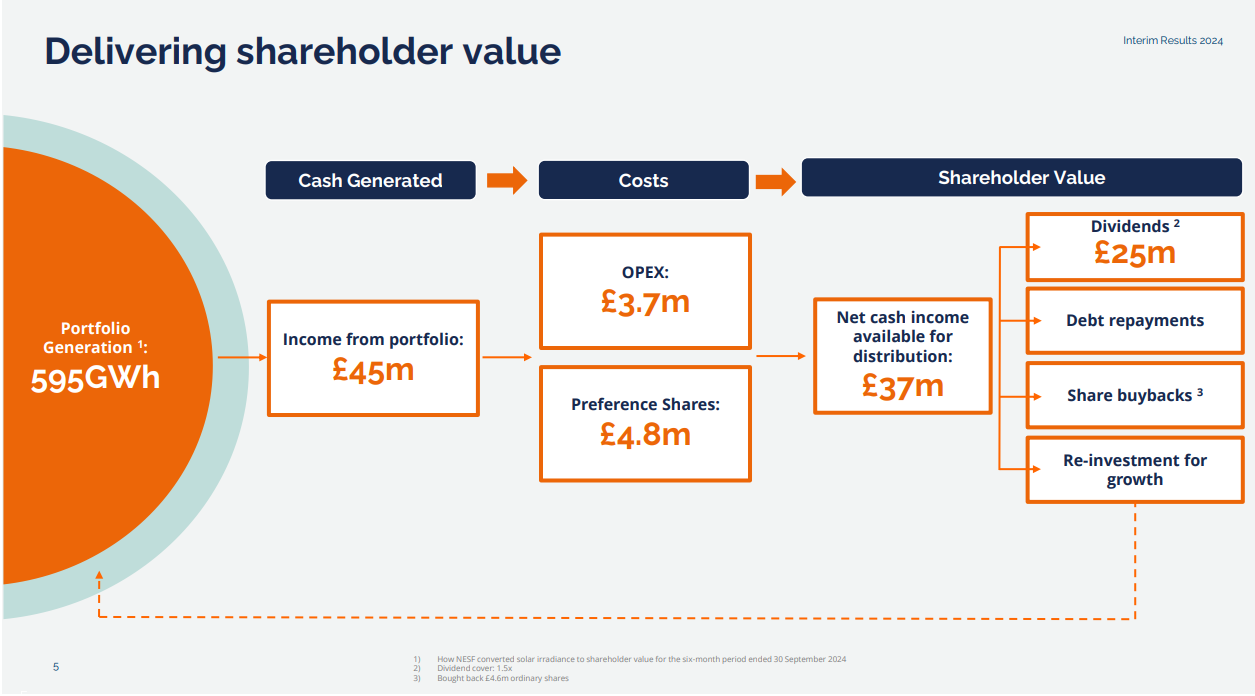
The forward yield is a very impressive 12%. (based on a 8.43p per share dividend). A 14.4% return when you consider the 2.4% buy backs.
Other points of note are its sales of assets as a 14%-21.5% premium to NAV (a further programme begins in 2025). Consider that vs NESF’s 28.2% discount to NAV. If 14% is indicative of the portfolio then the true discount to NAV is actually 37%.

This is the operating portfolio:

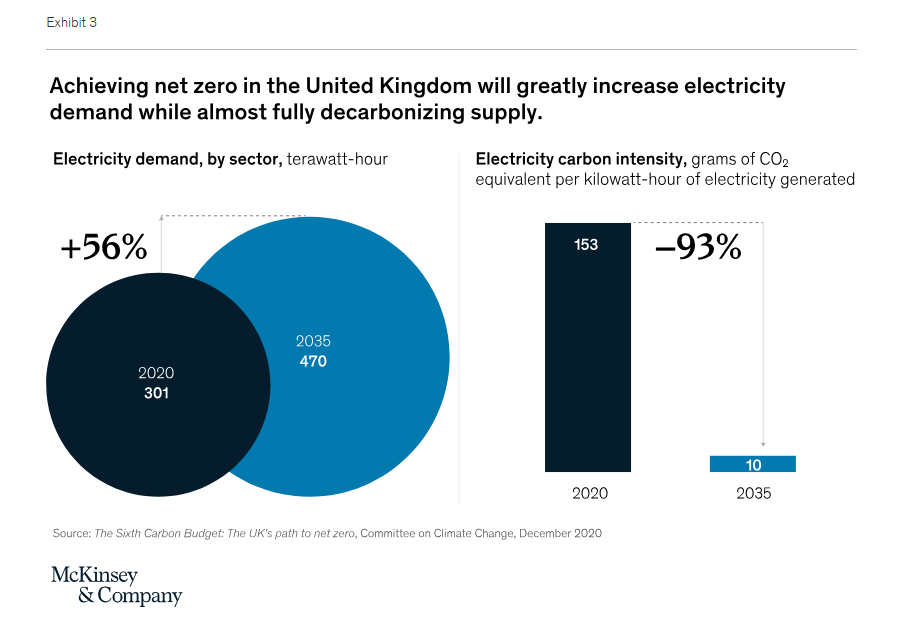
Consider that electricity demand will increase by 56% over the next 10 years.
Yet we see the “experts” proclaim that the NAV should be reduced by -£17.8m due to gas prices and short-term power demand expectations.

2024 consumption was higher than than 2023. Perhaps the “experts” are a little confused over what NESF sell? Solar Panels do not produce Natural Gas but power experts do appear to emit hot air.
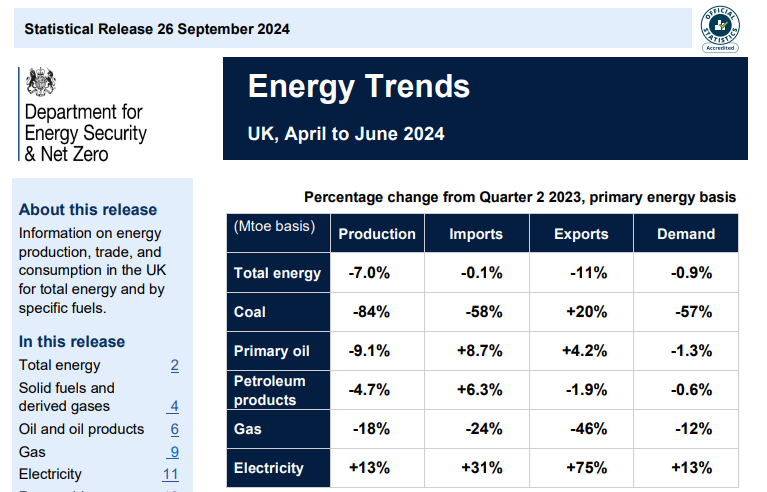
Meanwhile the Dept for Energy Security & Net Zero tell us that consumption of Electricity is up and other forms of energy are down.

Energy storage assets are a growth area for NESF. These enable NESF to capitalise on existing infrastructure including existing grid connections and inverters, meaning OPEX is optimised, but also that solar generation can be sold at optimal times (i.e. early evening). The idea being that the 92 UK sites could be retrofitted over time with energy storage. Currently 1 50MW site live, a second pre-Construction of 250MW, a smaller 6MW co-located storage 1 has planning, and 4 applications are in progress.
Interestingly, the power price forecasts include a “solar capture” discount, which reflects the discount on pricing in daylight hours versus during baseload hours. With the introduction of storage such a discount would disappear - so create a positive reversion for the NAV that not only do you add the asset to the NAV but you also remove the solar capture discount too.
Forecast Prices & Discount Rates
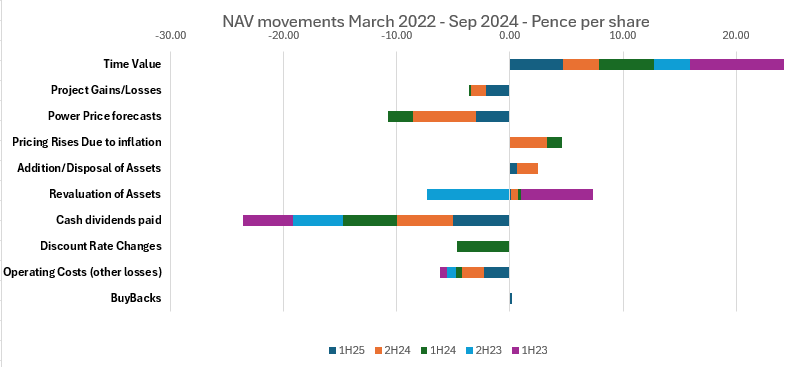
NESF reveals substantial drops due to discount rates increasing to 8% and short term power prices falling also.
When you strip out that “noise” and focus on the real movements roughly inflation protections offsets power price forecast changes, income nearly covers dividends (and in the 25% higher irradiance in 2022 would have fully covered the dividend), while asset capital gains offset project losses and other losses.
Looking forward it appears that Power Price forecasts will eventually return to a positive, as will the discount rate. It wasn’t clear to me that the forecasts are considering the subsidies, the ROCs and the hedges that NESF employ. Much of current year is hedged and several years ahead also.
Considering the valuation beyond the “Power Price”
A further proof point is that the fund is selling assets at a premium is a strong proof point. But I considered simply following the money.
Now with the HoldCo and the obfuscation that goes on that’s easier said than done. But I persevered and think I managed to find some good insight.
It was at this point I decided tempting NESF was not going to be an Oak Bloke 2025 idea after all.
Why?
What was the “but” for the Oak Bloke?
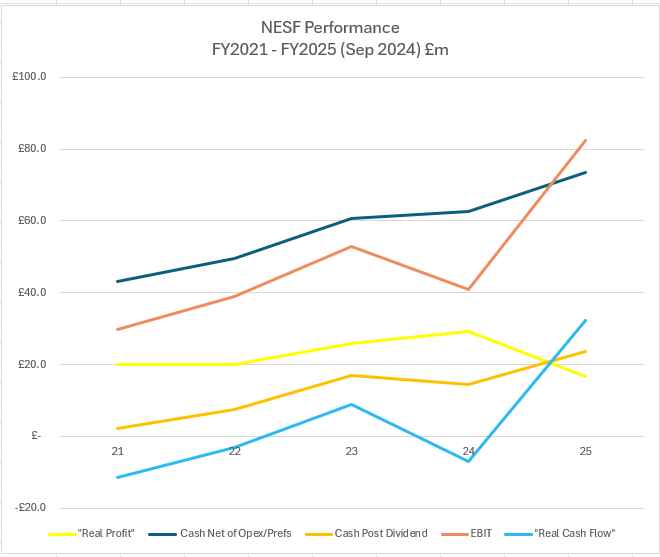
In the yellow line I took the income (I’ve doubled the numbers for 2025 because we only have the interim result) and then I deducted the overheads but also calculated the depreciation by taking the difference of the HoldCo EBITDA and EBIT.
All looks really positive doesn’t it? But what if we consider depreciation AND dividends.
Ouch.
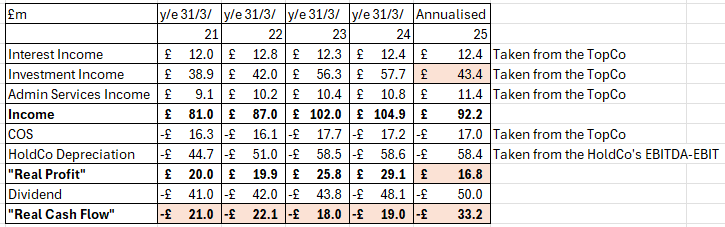
If NESF didn’t operate the obfuscating HoldCo structure this is what I believe the real picture would look like.
The “real profit” where we hope income exceeds the replacement cost of capital. And it does. However this real profit needs to pay dividends and it doesn’t fully cover that.
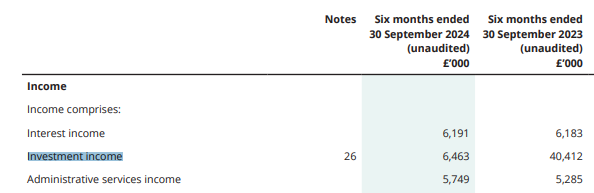
Also of concern “Investment Income” is down in FY25. There is a degree of further obfuscation by NESF as to the reasons why.
Part of the reason for this fall is the extent of the actual vs budget output.
If you look at the “expected” values in the chart below the differences add to nearly 40GWh or 7% of the budget. The report speaks to a 4.5% below budget (excluding i.e. plus factors outside NESF’s control). So 2.5% was beyond control perhaps.

Certain metrics like cash flow appear pleasing - that the assets can generate a cash return able to cover the dividend. Moreover I also observe a comment about the 25 year life of assets and the fact that there’s no reason why the assets cannot be used beyond 25 years - subject to lease agreement and also to replace defective parts. NESF do speak to doing this - and nowhere is that in the price. Given the assets are around 10 years old extending 25 year old assets to a 30 year life would drop depreciation by a third - or £15m per annum. The sale of assets at a premium could be explained by the depreciation policy simply being too aggressive.
But the problem is I just don’t know if that’s the case, or at what cost.
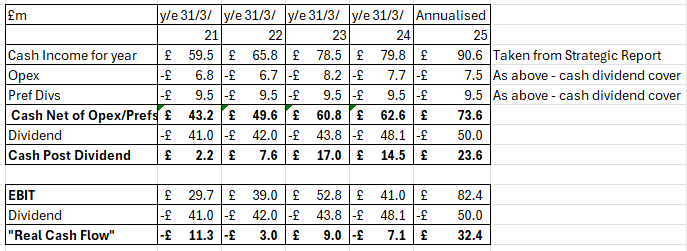
Taking the FY25 real cash flow as earnings values NESF at 12X at today’s share price.
But the EBIT of £82.4m doesn’t reconcile with the reported earnings. If I instead use the “real profit” earnings FY22-FY25 of £23m the calculation is nearly 18X the share price.
Conclusion
Whilst NESF offers a great dividend and is selling its assets at a premium I am concerned when I value this on a simple cash generation minus depreciation minus dividends basis.
I find the numbers are not sustainable. To determine the income I’ve used the £15.2m cash returns plus £6.5m dividiends from HoldCo to TopCo.


I’ve reviewed a lot of comments in the chattersphere. No one seems to have noticed the drop in income!
What I saw as boring and safe with upside I now see as fairly valued at the current price. The nearly 50% drop in “investment income” worries me. Arguably dropped over what is potentially the better 6 months of the year too (the summer months).
The fact that NESF don’t address this anywhere worries me. The moving of some returns to repayment of intercompany loans could be a way to hide the evidence?
The 7% fall in availability will explain part of the reason it’s sure. The lower 6.9% yield is connected and will explain part of it too. But why not just be open about that?
Perhaps the other reason for the fall in income is that power prices are falling and the UK is about to enjoy years and years of cheaper electricity after all. Labour did promise cheaper bills didn’t they? Right now we are in the midst of a colder winter for Europe in 2024 and my power prices just increased. With our new government knifing Oil & Gas in a populist tax grab of a globally leading 78% margin rate I’d be surprised if it’s the reason. Plus what about all the subsidies and PPA pricing?
But again we simply don’t know.
I conclude to say I would question the sustainability of the dividend. It is “covered” only if you ignore depreciation. In other words NESF is eating its seed corn by paying current dividends.
After coming close to including it, NESF is not one for the OB 2025 ideas, despite the alluring attractions. (the OB idea SEIT does stand up to this same scrutiny by the way)
Will this be the final episode for NESF? 8pm on Christmas day is when all’s said and done (including the incident on the boat maybe?).
Regards,
The Oak Bloke
Disclaimers:
This is not advice
In general, Micro cap and Nano cap holdings, might have a higher risk and higher volatility than companies that are traditionally defined as "blue chip".
based on the revenue per mw the dividend is firmly covered, apologies for brief message but spent hours pouring over these accounts and individual co accounts, this company is managing things well
Coming to this post rather late, I noticed that 'Note 26' was attached to the Investment Income line including the £6.463M value for the latest half year. Note 26 turns out to be a masterful exercise in obfuscation, that goes some way to explaining the disappointing September 24 Investment Income figure at the same time as ringing alarm bells in relation to the complexity of flows between the parent and subsidiary companies - exactly in line with @OakBloke's wider comments.:
"....At 30 September 2024, £9.6m (30 September 2023: £31.3m; 31 March 2024: £6.9m) was owed from the subsidiaries, being cash trapped within the structure at period end. £5.7m of administrative service fees were received from the subsidiaries during the period (30 September 2023: £5.3m; 31 March 2024 £10.8m), £3.5m of which was outstanding at 30 September 2024 (30 September 2023: £2.0m; 31 March 2024: £1.5m). £6.1m of Eurobond interest was received from the subsidiaries
during the period (30 September 2023: £6.1m; 31 March 2024: £12.3m), £nil of which was outstanding as at 30 September 2024 (30 September 2023: £nil; 31 March 2024: £nil). During the period, dividends of £6.5m (30 September 2023: £40.4m; 31 March 2024: £57.7m) were received from the subsidiaries. Refer to note 11 for terms and conditions on amounts due from subsidiaries. During the period, the Company commenced receiving cash returns in the form of repayment of
intercompany loans in preference to investment income, amounting to £15.2m (30 September 2023: £nil; 31 March 2024: £nil) received from the subsidiaries (included in Investment Proceeds from HoldCos in note 17)...."
At least £15M of investment income seemingly gone awry can be explained by "During the period, the Company commenced receiving cash returns in the form of repayment of intercompany loans in preference to investment income...", but all in all I have to agree that it all seems too opaque, for what one would hope was a stable and straight-forward income stock.