


Great Scott! The portfolio battle update
PS, ST, CA, Arby and the OB 2024 Investment Ideas are 5/12th through the year - who's winning? And who gets the booby prize?


Dear reader,
The contenders continue into a fifth month. This is my 250th article. A one quarter millennium of articles.
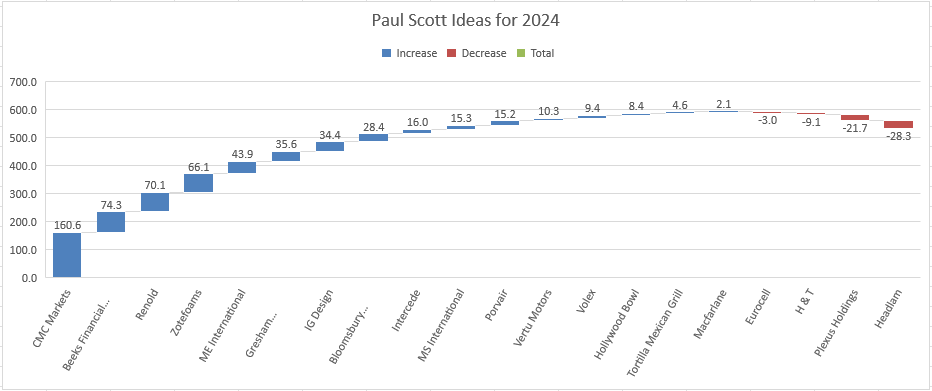
#1 Paul Scott +26.64% YTD
Clearly out in front is Mr Scott, clearly the guy with the scores on the doors (George Dawes). Investment picker extraordinaire! A whopping 26.64% YTD! Annualised that’s nearly 64%! Credit where credit’s due and the honourable thing to do is to say if you are impressed by this result, reader, to investigate a Stockopedia subscription where Mr Scott writes a daily Report. You can even get 14 days for free using the link below. You can also listen to Paul’s weekly podcast on iTunes, as I do. NB I’m not connected with Stockopedia, nor is that link an affiliate link. I just think credit where credit’s due that’s all.

I will write some commentary in a separate article, Great Scott - Part Two.
2nd Place - ARBY Loss YTD -1%
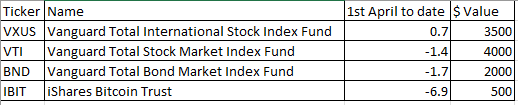
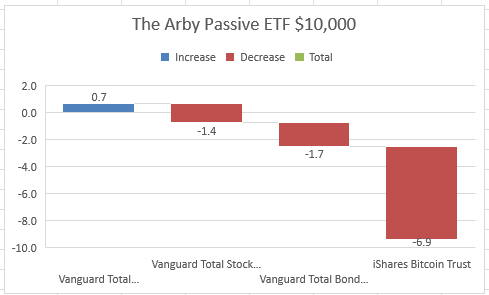
2nd comes Mr Arby. The passive portfolio runner. Can a US ETF, an Ex-US World ETF, a Bond index, and a new fangled Bitcoin ETF beat the active picks of the four intrepid pickers? -1% YTD. Yes to three. But not Mr Scott who leaves the passive portfolio choking on dirt. But 1 active winner and 3 active losers, are you wasting your time reading any of this? Should you buy a passive and go and do something more interesting instead?
The other 3 active pickers have a mere 7 months to prove active can win over passive! Who will bring up the rear today?
Commentary:
Arby’s passive portfolio was suffering for most of April until Bitcoin came whizzing up to near to $70k in May. Nevertheless, there’s a lot of red but the 75% VXUS/VTI weighting limits this to -1%
I did, in a recent moment of madness, consider a small toehold in IBIT. But words like ponzi, profit generation and electricity made me see sense again. A single bitcoin transaction uses 400,000X more power than a Visa transaction. Who pays the cost for 400,000X more power? The cost today AND tomorrow - once 2.1m bitcoins are “minted”. How do the transactions continue afterwards? Which transaction medium collects a ~2% sales commission to pay for that power? (Clue: It’s not Bitcoin). So how is Bitcoin not a Ponzi scheme? And consuming 400000x the electricity…. How is Bitcoin not disgusting!


Just to show the extent of Crypto’s influence this will shock you reader.
VXUS the ex-US tracker is Arby’s best performer. But the volume of VXUS vs IBIT is about 1:10. That gives readers an idea of the sheer number of people messing around with Crypto. 10X as many as who trade in a global tracker. Clueless. Even VTI - a US index is 3m vs 20m so less than 1:7 the number of bitcoin txns vs a US index.
Crypto rant over. :)
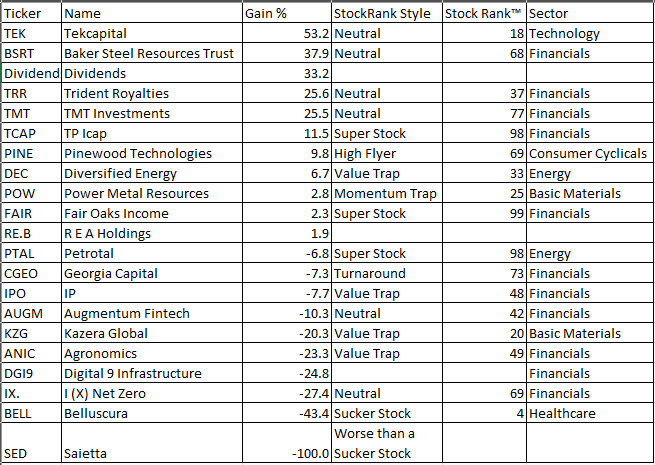
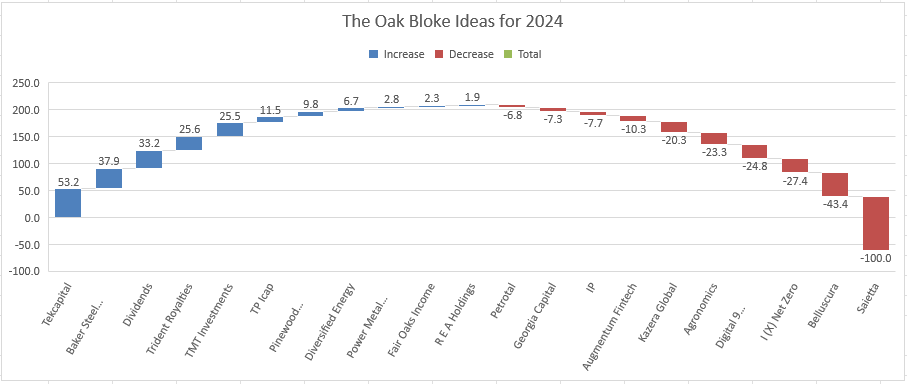
YTD -3% The Oak Bloke
Hallelujah! It’s not me in last place! Puff puff puff, I can do it, I can do it. I’ve moved from -5% to -3%, despite my 5% penalty for picking a 100% LOSER in Saietta.
I will write a commentary in part two on my views of where the remaining OB 19 go next.
4th place InvestmentStrategy -4.5% YTD
Talk about luck! One of InvestmentStrategy.co.uk’s 8 ideas for 2024, GMET, rose 16.8% today and 132.6% YTD. That made Charles’ portfolio rise 4.4% from -8.9% YTD (and from -20% YTD during most of May) to pip Simon Thompson’s BargainShares2024 to last place. Photo finish!


I notice Shuka has gone from zero to hero, so that intrigues me a bit - one to examine in the future. BSFA is a cellular agriculture holding like my ANIC but is really suffering on a whopping -58.9% YTD. GMET superb +132.6% performance deserves some comment in Part 2 too.
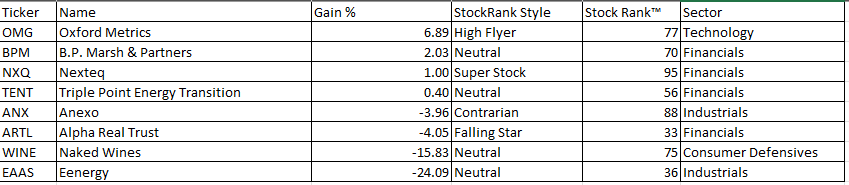
5th place Bargain Shares 2024 -4.5% YTD
5th place by a mere £15 on an £8000 portfolio (so 0.2%) comes Simon Thompson.
Mr Thompson is a heavyweight competitor with his famous Bargain Shares that for most years have delivered outsize returns and his 352k Investor Chronicle readership which clearly moves markets. Despite many years of delivering winning Bargain Shares, the 2024 picks haven’t picked up steam…… yet.

OB Commentary
I felt BP Marsh was a bit pricey and wondered how much upside it could deliver. 2.03% so far.
Good ol’ TENT 0.4% YTD. As a 12 month pick I can’t see this will deliver a large return in 2024 - I considered it for the OB20. I keep saying I’m going to do a compared and contrast across the renewable sector but it’s a big job - I’m part of the way there - and I hope it’s worth the wait.
Rules are rules it’s your performance from when you release your ideas until 31/12/2024. Bargain shares was released 9th Feb. By that point Nexteq had already risen strongly, so since then only 1%.
Anexo released some positive news about case law precedent which should be bullish but so far gains haven’t materialised. The newsflow with Anexo is so sporadic. The debtors didn’t reduce by much in the last update - and that remains a red flag. Are they debtors or are they “order book”. They feel like the latter.
ARTL is probably not down but static and buying at a spread (rules are rules and you don’t get to pretend bid/ask spreads don’t exist or dealing charges either - a modest £4)
The losses at Naked Wines are down to “material uncertainty” and potential for covenant breaches. Could this turn into a 100% loss? Or will it trade through to a huge turnaround? With only 8 ideas a total loss would be a catastrophic 12.5% penalty. Eenergy looks more interesting. EEAS announced a £40m project funding facility with a 2nd facility to follow - now this could be the making of EEAS. The orignal rationale for these ideas are hidden behind a paywall - so I’m guessing at the reasons why these made the Bargain Shares list or any subsequent commentary.
Bonus Content - examining the runners’ Styles.
Since I had everyone’s performance and had extracted their CURRENT style, I thought it would be interesting to take the sum of gains and losses. The results are interesting. High Flyers appear to be the best, then momentum traps and only in third place are the Super Stocks….. did you expect to see that reader? Unsurprisingly, value traps and Suckers are worst.
PS has lots of High Flyers and I’m adding them in this chart. For non stocko people each stock is given a status and “Super” is “best” and “Sucker” is “worst”. High Flyers are almost the best. However, this is their status as at 31/5/24. 4 of the OB 20 were “suckers” at 1st Jan but now only 1 is a sucker. As stock performs better they are promoted to a better style. I didn’t write down all my styles as at 01/01/24 just which were the suckers.

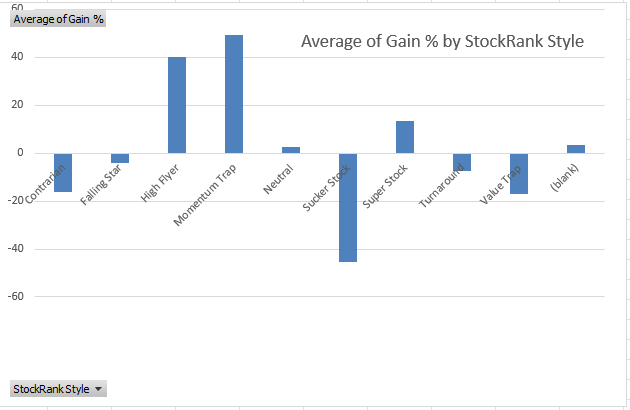
It then occured to me that taking the average gain or loss is a better metric. Now it gets even more interesting.
Momentum traps, on average have performed the best. Didn’t see that one coming.
At least across the 20 OB, 20 PS, 8 CA, and 8 ST picks = 56 stocks. Well 53, because 3 were blank and aren’t given a style.
GMET is a momentum trap that skews the numbers. 2nd place are the high flyers and super stocks are far lower. Interestingly contrarians and Turnarounds lost money YTD - on average. Obviously this is just a sample not the whole market.
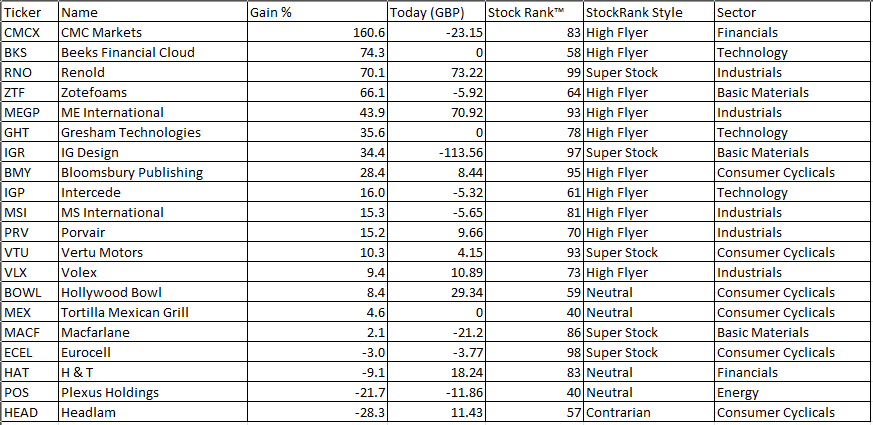
A final analysis was to take the Stock Rank (TM) and to map that across performance. So going up from 0 to 100 is the rank (lowest is zero, best is 99 I think). On the horizontal is percentage return YTD.
On the far right is CMC markets and it’s an 83 score. Moving to the left GMET is 132.6% on a rank of 21. Some “99” scored holdings are negative YTD.
But generally the expected correlation of bottom left to top right is sort of there…. sort of. I don’t particularly follow the ranks and must admit to some degree of healthy scepticism, but this quantitative analysis does suggest the scores offer some degree of guidance.

Now it just so happens while I didn’t record the style as at 1st Jan I did write down the Stock Rank (TM) of the OB 20 at the 1st Jan.
So TEK, BSRT, RE.B, KZG have increased in their score (red is 1st Jan, green is 31st May). DEC, POW, ANIC, PINE, TRR have all decreased.

So does a change of score predict a YTD share return? Yes, sometimes. POW drops from 98 to 25 yet has still delivered a positive 2.8% return (more on POW in Part 2). Meanwhile BSRT delivered a 37.9% return and increased in score by 30.
In the quadrant below, the top right square is a positive return and an increasing score, in the top left an increasing score but a YTD loss, bottom right a decreasing score but a postive YTD performance, while the bottom left - a YTD loss and a corresonding decreasing score. Half behave as expected and half don’t.
Or are the top left ones predictive of future success? i.e. The stock rank score has increased and better performance will follow later? The 3 are PTAL, RE.B and KZG. Fascinating.
Or the bottom right predictive or future failure? i.e. You’ve achieved a positive YTD but the scores tell a negative story ahead? POW, TRR, TMT, PINE and DEC are the 5 you see there.

Time will tell.
Sorry, reader, my curiousity led me to analyse my sample data and I’ve either intrigued you or completely bored you….. I’ll leave it there, anyway, and invite you to read Great Scott! - Part 2 - the commentary. Which follows shortly.
Regards,
The Oak Bloke.
Disclaimers:
This is not advice
Micro cap and Nano cap holdings might have a higher risk and higher volatility than companies that are traditionally defined as "blue chip".
Great to see the results YTD. Happy with my second place given this portfolio required <5mins all year to set it and forget it. Having a kind disposition I won’t apply any opportunity cost for all the hours the active managers spend on activity they believe will give them some kind of edge. Many thanks and good luck to all.
Hi Oak Bloke! What a lovely article, that made my day! Very generous comments from you, thanks. I should add that my colleague Graham Neary has out-performed further - his top 10 share ideas for 2024 list is currently up 29%, versus my 27%. We don't include divis in that either, but neither do we allow for bid/offer spreads or dealing commission, so I reckon it probably roughly nets off.
We mustn't get too cocky, as both Graham and I have now had 2 strongly out-performing years on the trot, in a market that's been kind to our value/GARP approach. As we enter a new bull market, your more speculative stuff could begin to shine, as people once again take on more risk, as we see in every cycle. Thanks for an interesting blog, and your kind comments, much appreciated. Paul Scott.