
SDIP-ping into yield paradise
Is the 11.24% High Yield ETF worth it?


Dear reader
A monthly dividend, almost 1% a month. Does that leave you slightly salivating, reader? You’d have to have dysfunctional salivary glands wouldn’t you?
It is tempting.
But is it safe. Let’s try to assess that.
SDIP is run by a large German index operator called Solactive.

The reason many avoid this ETF is historically capital losses appear to offset the rich dividend income. Over three years, shows SDIP as having a “continuous” 30% fall during which time is would’ve provided around a 33% income. Like a dragon consuming its own tail things are not going to end well….. apparently.
But look at just the past 1 year - the picture improves - capital losses are near zero.

Zooming out gives the best (and fairest?) picture of all. If you go back 13 years (I could only find this view on Solactive’s own web site to when you query your usual tools or your broker’s tools you can’t see this full picture for some reason)
Since inception, your capital AND dividend (total return) losses would actually be 10%
so while there are periods of growth 2020 and 2022 were periods of sharp loss (net of dividends)

SDIP is listed as an income stock in the UK - not accumulation.

So the question is what causes the capital to drop?
The answer lies inside this document.
The index started with the Top 100 dividend payers across major markets. They then screen each quarter for any that have dropped below the Top 200 (i.e. 100 worse than the top 100) and replace them. They also screen for dividend cuts or an overall negative outlook concerning the companies’ dividend policy (“Dividend Cut Review Date”). Theoretically if you’ve got a high yield company that is in financial trouble it doesn’t get picked. Certainly all of the samples I took were well established - I share some examples below.
If any changes need to be implemented, the index will be adjusted at the close of the last trading day of the month. Companies may be excluded on quarterly reviews and replaced with the top ranked company from the selection pool that is currently not an index member (i.e. position 101). The company that is added to the index composition at the quarterly review dates will be given the same weight as the member that will be deleted, calculated as of the trading day before the adjustment takes place.
Also SDIP is rebalanced quarterly over a five-day period (“Rebalancing Period”). Beginning on the Adjustment Day, and continuing until the fourth Trading Day following the Adjustment Day. Essentially the winners are sold and the losers are bought each quarter.
Any Corporate Action event such as acquisition, tender offer, dividends paid etc etc is also considered and a formula is used to rebalance the holding. The formula below means that if I hold 100 units of share X with an index price of £100 (P) then receive a £10 dividend (D) this means I now need to hold 111 units instead. This assumes the £10 is tax free (no dividend correcting factor).
So the largest percentage dividends lead to me holding proportionately more of that share.
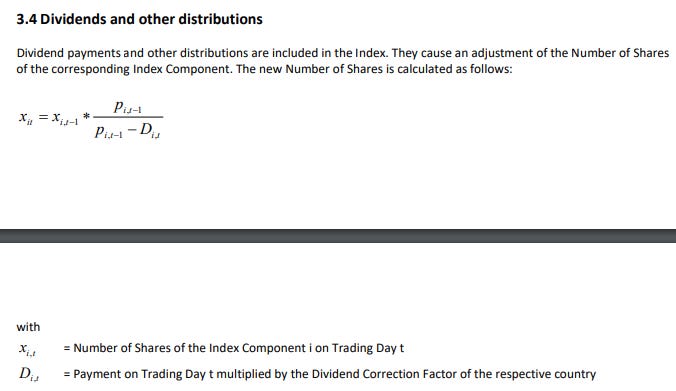

If I also have 100 units of Share Y also £100 and that pays 8%. Then 100 X (100/100-8) = 108.7 units. So the 10% share “crowds out” the 8% share over time.
In other words reader SDIP is a cold, calculating index relentlessly pursuing high dividends and capital gains or losses are immaterial to its judgment.
EXAMPLE HOLDINGS: 3 of the 100
I’m not going to go through all 100 holdings but digging in to some examples here’s what I found.
#1 Holding China Overseas Grand Oceans
Land Bank in Eastern China. Share price has halved in the past year and the dividend has been cut. Housing is in all sorts of trouble in China with 25m-30m unsold properties. It paid a 10% dividend but that is now 5.7%. This is an example of a holding that will get removed from the index, at the end of the quarter.

Meanwhile its share price has fallen, so rebalancing would’ve meant buying more each quarter to rebalance it.

#2 Orient Overseas - Chinese Shipping Co.

Dividends in 2022 were $3bn, and $0.6bn in 2023. An 80% cut. Ouch.
The Red Sea Houthi crisis, the Chinese economic downturn and falling shipping rates have all affected Orient Overseas.

#3 African Rainbow Minerals
Produced 16.7Mt of coal in 2023 and 581koz of PGMs. The dividend is around 9.5% and while it reduced in 2023, due to PGM basket falling it remains high.


In the SDIP Top 100 I see British names of BATS, VOD, Serica, M&G, DEC among the Top 100. That gives you an idea as to how they arrive at their top 100 list. Big established companies with big dividends, but cyclicals which do well in boom not bust.
Useful links:
This link gives you the current index composition (all 100) of SDIP
This link gives a news flow about what’s happening at the SDIP 100 holdings. (Very useful and a nice touch to have this - does this give an investor some level of comfort?)
Conclusion
Understanding that this ETF simply goes after the highest dividend and then periodically rebalances and periodically checks for dividend cuts (or threats of).
You end up invested in all sorts of weird and wonderful holdings across the world and that could be a positive - it’s a way to diversify risk - but a negative it would be hard to control risk. Also you might dislike the fact that ESG doesn’t feature so Coal, Armaments, even holdings in countries like China - may not suit some investors.
Basically if it generates a high dividend with no sign of ceasing it will be inside SDIP.
Having said all of that, visiting the www.solactive.com website and seeing the 11 year history and the full list of holdings along with a news flow I’ve come away feeling quite a bit more positive about SDIP. However a long-term net 10% loss after dividends is poor.
I’d also point out during periods of expansion and bullishness it actually delivers strong capital growth (AND a strong dividend). Many of the holdings are CYCLICAL. The problem is, during times of difficulty you can expect some capital losses. The “recency bias” to the past few years makes people think SDIP is doomed to lose money. History backs they up. But if you feel reasonably confident to time things, and are comfortable that the world economy will continue to do well, and so invest during a bullish period, you could generate a period of strong cash returns using SDIP.
Regards
The Oak Bloke.
Disclaimers:
This is not advice
Micro cap and Nano cap holdings including those held in ETFs might have a higher risk and higher volatility than companies that are traditionally defined as "blue chip"
Hi ,
as always I apréciate your writing . Diving a little bit deeper into the data of the Solactive index and the link " Document " of Solactive i have to notice that the Price index indeed does contain the distributed Dividend(Point 3.4 of Document) . So capital losses since Inception are indeed significant and not even compensated by Dividends over the period.And i was just getting excited and started to salivate....
Interesting concept in that they’ve identified the high yielders but put checks & balances in place to have a human in the loop on the allocation.
I’ve always been intrigued by the O’Higgins high yield stock picking idea (originally on the Dow) but this is much more diversified.
On a practical note, my UK broker (ii) only seems to offer a Global X Superdividend ETF. I assume that’s not exactly what you’ve been discussing here.
Can anyone be specific about the exact ETF under discussion?
I’m being confused by the Solactive Superdividend “index” and ERF’s which track it.
Thanks