


Dear reader,
I've been thinking about the fun run.
Here we all are (least those who are watching the fun run) measuring by the share price and many (all?) people are fixated on that. Rightly so, perhaps, after all that’s the buy and sell price isn’t it? Pipe up at the end of 2023 (or later in some cases) to say that one thinks during 2024 these ideas will do well.
The fun run for any newbies is the simple idea that let’s take their “top ideas for 2024” from different folks and track how those ideas pan out during 2024. Each idea has an imaginary £1,000 invested in it at the ask price less £4 trading fee either at 29/12/23 or for Mr Arby who joined the race 01/04/24 or for Mr Archer who had ideas 29/12/23 but added further ideas 01/07/24 and Mr and Mr Roast also 01/07/24. Valuations are at bid price.
Today’s article which I started on 9th September (busy couple of days) thinks about two things:
First, do you ever work out by how much your own portfolio increased or decreased in value during 2024? Of course you do. But do you also work out whether your portfolio’s net asset value (NAV) increased (or decreased) too? Almost certainly not. Least I’d love to hear from you if you do. I was curious to understand how the OB ideas for 2024 have changed in NAV terms or book value.
So second, this article examines this for all other fun runners too. Due to the length of calculations this will need to be a two part article.
After all, the market price or share price is to some extent based on sentiment and not on “fact”. So doesn’t that make share prices an imperfect measure? Yes and no, because ultimately the share price is what you can buy for and sell for. But we also know that a business which is increasing its intrinsic value (i.e. its assets) over time will/should be worth more. After all, how does NAV increase anyway? What are you measuring? Assets increase as cash flows are generated in excess of costs (i.e. the net profit part of the P&L makes its way to the balance sheet each period and the change in retained earnings is the net profit). So while considering the future stream of profits (i.e. future return) would be an even better way of valuing businesses this is always a forecast or estimate whereas the change in NAV is the current results - or “facts”.
Of course “facts” is in speech marks because there are limitations to measuring book value due to accountancy rules.
IFRS 13 - fair value - if you are holding assets as an investment then you judge its fair value. You book gains and losses each period called FVTPL (fair value through P&L) for equity and through FVTOCI for debt. But if you instead have to use a consolidated approach rather than an equity-based approach then you can’t value assets at fair value. Instead they are held at book value.

Generally 50% ownership or above necessitates a consolidated approach (since these are effectively subsidiaries of your company) but if your ownership dilutes or falls then you can adopt a fair value approach. Netscientific booked I think it was a £2.2m gain when one of its holdings fell below 50% ownership.
IFRS 9 - derivatives - DEC-hands have seen how unsettled derivatives for future years have to be presented in the accounts at their fair value. The problem with this approach is that you are not matching costs and revenues properly. The future costs (which in DEC’s case go forwards 8-9 years) are being considered as due in 2024. Considering future costs would be fine if you also considered the corresponding revenues too but IFRS9 only provides for costs. So in reaching a net asset value an investor, I would argue, has to exclude this portion from calculations.
Net asset value is also generally at book value. If you are fortunate enough to buy an asset cheaply then you don’t get to revalue it upwards. Jubilee Metals for example owns a copper refinery in Zambia. It bought it for a bargain price and to build a 2nd refinery from scratch would cost several hundred million USD. Yet it has to be held at its purchase price less depreciation.
Net asset value will also sometimes hold goodwill and intangibles (IFRS 3). This is generally the excess paid for acquiring a business above the value of its assets. It is usually equated to the value of brand, know how, IP and so on. In some circumstances you can capitalise know how and IP too. Where a business doesn’t do this (i.e. it expenses its R&D) this can be a form of hidden value. I spoke recently how Puretech expensed all of its R&D recently, and none of it was sent to the balance sheet.
Eagle-eyed readers will know that the OB has a bee in his bonnet about the discount rate which is an arbitrary measure applied by experts (and confirmed by auditors) where you discount future cash flows according to risk and the cost of money (the risk-free rate). Changes in NAV can just be changes in perspective as to that level of discount, higher or lower. No actual gains or losses have otherwise taken place or the gains are accentuated or blunted by the discount rate. This can apply to future revenues and to future costs - liabilities. The Asset Retirement Obligation (ARO) is an oft-discussed measure where you increase your level of liability over time because you want your liability to match your matching income. If you are going to extract gas for the next say 50 years then the end-of-life costs are spread over those 50 years. Just like if you were to buy and use any other kind of asset - a machine, or a car. We see depreciation as a cost but it’s a sort of sinking fund, where you recognise the cost of an asset as it is consumed which reduces profits which could otherwise be distributed to the owners of the business.
One problem of measuring using NAV is that it is a trailing measure where we only know the precise amount twice a year unless the company is an investment company which publishes a more regular NAV. For non-investment companies we just get the full year results and a NAV from the interim results. Typically, smaller businesses do not rapidly provide these. There is a 6 month limit (or your public listing is suspended). So one problem I am going to run into in this article is a business valued at X per their 31/12/23 accounts (or earlier) may or may not have their interim results released yet. So some fun runners get a zero result (positive or negative) simply because we do not know yet. Perhaps I’m a month early in writing this article, or perhaps I’m exposing the achilles heel in investing - we drive down the street using a rear view mirror.
So while there are limitations to measuring NAV especially solely over a 12 month period, it nevertheless has helped me expose some areas of value in my own portfolio. Also you can see there’s a healthy level of discount to NAV from today’s share price across most holdings.
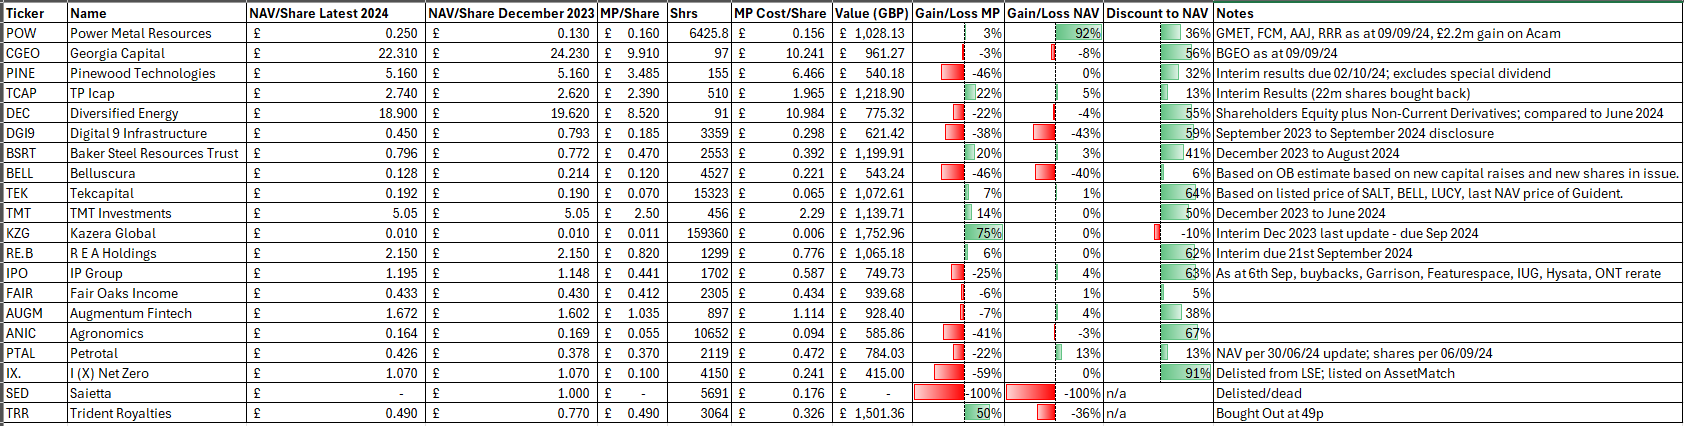
POW - I’m using the (publicly listed) market caps of POW’s holdings to work out a 92% gain to NAV (where I am deducting the book value of GMET etc as at 31/12/23). Given a 3% YTD share price move that is obviously undervalued. Today’s news of “yet” another porphyry should be positive and much of POW’s NAV is not in the price in any case. POW is the first example of where monetising its holdings through sale, IPO or JV has helped turn a book value into a market value.
CGEO - this is an interesting example where the NAV is down 8% but I know that the portfolio performance is up by over 100% compared to 2023. An increase in discount has caused most of the 8% fall. So NAV is also affected by a moving measurement in investments where the value of those investments is reduced by a discount rate.
PINE - this exposes another limitation to measuring performance using NAV is that while this is down there was also a large dividend which explains the fall. A better measure would be to consider NAV plus dividends to understand the generated value.
TCAP is an example where the book value of assets might underestimate their true worth. In TCAP’s case it owns data. What’s that worth? Well if you compared it to Beeks, to the London Stock Exchange or similar more than its current NAV. Therefore TCAP is planning to IPO its data arm called Parameta, while retaining a majority share. The reason being, like POW, it will monetise the asset. Some think Parameta is worth more than TCAP! We’ll see. I have argued that Fusion for example in “problem we have a Houston” is actually just as significant since it brings together all of TCAP’s products and services (including Parameta) into one single console.
DEC’s NAV is based on excluding future (non-current) derivative costs and arrives to an astonishing 55% discount to NAV. I’ve covered this and DGI9 recently so my theory is that the NAV at DGI9 has been moved downwards by a “net realisable value” calculation. Such a calculation would occur if an offer had been made for assets, and we do know non-binding offers have been made. Jumping ahead to TMT I covered in my article “TMT-oh tomato” how a silly offer for one of its holdings Panda Doc in 2023 caused a $2.8m drop in TMT’s NAV. PandaDoc at TMT also introduces us to the idea of a funding round and how that influences the fair value too, in a positive or negative way.
We also examples where holdings at high discounts to NAV are now seeing a shrinkage in that level of discount. BSRT for example where the NAV has grown 3% (albeit we are told Futura still carries a development discount until December despite being operational), but the share price is up 22% (down by over 10% recently on general pessimism towards mining). Although we see KZG rising rapidly on news and sentiment with no NAV change partly through no interim result to 30/06/24 but partly that the only changes are first the permit for HMS mining has been granted and operations begin but also enforcement to recover its £7.3m debt (for a market cap of £11m)
Both Petrotal and IPO stand out for me as shares who NAVs have grown during 2024 (note the IPO NAV is my own estimate, while PTAL is the 2Q24 NAV), yet their share price has fallen. PTAL perhaps alongside other O&G and IPO due to an ongoing negative sentiment towards its major holding Oxford Nanopore. Interesting to see ONT has recovered from its 2024 low and is up 60% from that low. Probably not least due to Novo Nordisk’s placing and holding in ONT.
ANIC
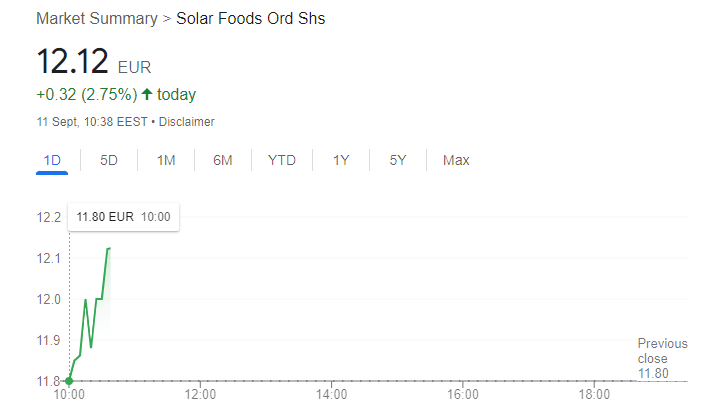
Agronomics also stands out as a holding where the share price has fallen on no bad news and the NAV has remained strong. In fact considering its first holding has now IPO’d (and covers 30% of ANIC’s share price, i.e. 1.65p per share and is up 2.75% today) and its portfolio overall have raised $250m in new funding in the past year (despite the horrendous environment to growth shares), including funding from major industry players like REWE (the “Tesco’s of Germany) and working in partnerships with major industry players (like the “Cadbury’s” of Japan). It is simply being ignored.
ANIC also announced a $61m fundraise at Formo (whose NAV equates to 17.5% of ANIC’s share price i.e. 0.96p) which has actually launched the world’s first Koji Protein-based cheese alternative. Frischhain is a pioneering product that is now being sold at over 2,000 REWE, BILLA and METRO stores across Germany and Austria. REWE (also an investor in Formo) actually has 11,000 stores (Tesco has 3,712 by comparison) and a turnover of €84.4bn.
Camembritz, a creamy white mold cheese and Frischhain Tomato will follow in a few weeks. Frischhain production generates 65% fewer emissions, uses 83% less land, and requires 96% less water.
Formo replaces Cow’s milk with Koji. What’s Koji? It has been used in Japanese cuisine for centuries to make miso, sake, and soy sauce.
Sunday Roast Phil
It was difficult to come up with any YTD numbers to consider these three. These ideas were as of July 1st in any case, so taking a December to now view is generous in any case. The one aspect which concerned me was Incanthera having a negative balance sheet. Yikes. The newsflow remains bullish (a skin cream where nutrients can properly penetrate the dermis) but from a NAV point of view, yikes. It was interesting to see JLP on a 22% discount when I know its Copper refinery and assets were bought at very low prices. The true discount to the realisable value of assets is higher I believe.

Sunday Roast Kevin
Guardian is a further example where book values don’t reflect commercial progress and what’s (potentially) in the ground. It is salutary to see the market price is 337% of the last NAV.
It was very interesting to see East Star from a NAV point of view is actually a lot stronger so the 39.1% loss since July 1st has been a retreat from NAV price to well below NAV. Given their partnership and financial support from BHP and the fact they’ve completed a 2,800-sample soil sampling for copper in Kazakhstan and awaiting assays it’s a funny time for this to nearly halve. The “paleozoic Balkash-Ili volcanic arc” hosts multiple copper and gold rich porphyry and skarn deposits with the best-known examples including Kounrad (~650Mt @ 0.59% Cu), located 145 km south of Snowy, and Aktogai-Aidarly (~2.5Bt @ 0.39% Cu), located some 80 km to the south of Ayagoz.
TM1 was another negative equity and another yikes. But perhaps there’s more to the story.

Bargain Shares 2024
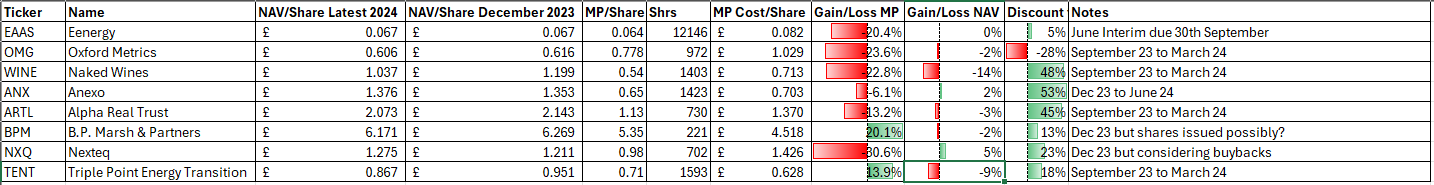
There were quite a number of holdings where the update doesn’t stretch beyond March this year. Again the bargain shares were 9th February so I’ve used the YTD measure and given this the benefit of an extra month (given it’s impossible to know a NAV start point from the 9th Feb.)
Nexteq stands out as accretive buy to buybacks yet its share price has fallen. BP Marsh and TENT whose share prices have grown despite falling NAVs and others where share prices have fallen despite no real underlying change to NAV, at least none we yet know of. The three with “large discounts” to NAV struck me as having the wrong kind of assets…. Naked Wines and large amounts of stock, Anexo will large amounts of debtors (which didn’t appreciably shrink and I share Stocko Paul’s major concern as to the opacity of these debtors, his comment I wouldn’t buy it at any price made me chuckle), and ARTL with large amounts of commercial property. It made me consider whether my large discounts to NAV are similarly affected. I’m happy to debate the point but I say no, and much of the discounts in the OB19 are real assets generating incomes or listed holdings so publicly tradeable.
To conclude, a deep dive into the NAV has unveiled a couple of points which weren’t so apparent so has been a useful exercise. Quite a time consuming one, mind. Would I regularly do this going forwards? Selectively, yes.
What about you reader? Any insights you would like to share? And would you, have you measured your portfolio by changes to NAV over time?
Regards
The Oak Bloke.
Disclaimers:
This is not advice
Warning. Micro cap and Nano cap holdings covered in this article might have a higher risk and higher volatility than companies that are traditionally defined as "blue chip"
I think there is a stronger argument that a 12 month time period is restrictive rather than a SP is more subjective than the NAV