


Gore to the Cor
GSF announces a £10m/12 year resource adequacy bonus


Dear reader,
Back on 2nd October in “Bore, Claw or War” I wrote (about Californian electricity resource adequacy):
Noticeably these pricing forecasts exclude the long-term fixed price Resource Adequacy contract in California (CAISO), as well as GB capacity market contracts. There are no details of the specific pricing agreed but the average bid in 2023 was $202/MWh (£151/MWh) which is 10X the MWh rate for GB in 2023!

Given the long-term fixed price, and large 400MWH capacity of Big Rock, and expensive California prices, the mathematics are astonishing.
Therefore I was delighted to read yesterday’s news:
$14,000,000 per annum for 200MW equates to $70,000 per MW per year and dividing by an average conversion factor 8800 gets us to an additional $7.95 per MWh.
Using Texas 2023 rates of £100k MWh/year x 400 = £40m + £10.5m = £50.5m revenue and an additional £33.5m EBITDA.
Separately the 150MWh Dogfish asset at the same assumed £100,200 MWh/year is a further £15m and £10m EBITDA too.
Given the 2023 operational EBITDA was £28.4m these two assets now appear to represent a £43m increase of EBITDA profit!
Now there are some timing issues where the RA contract begins mid 2025 so an EBITDA profit of circa £35m for 2025 is more likely.
For 2026 and beyond the outlook appears positive for GSF’s US assets which I discuss in the implication sections below. Greater levels of renewables penetration alongside retirement of Coal and other assets. However supply of BESS is increasing too, so record rates in Texas will reduce by around 40% GSF believe.
The 7p a share dividend equates to £34m. I wondered to myself to what extent is that going to be covered if I apply some reasonable assumptions?
While I was contemplating this a reader helpfully wrote:
Dogfish is on track to be energised in Feb 2025. It will be 75MW. Full operation seems to be three months after energisation so that will be May 2025. Average ERCOT rates from May 2025 to May 2026 will be about £125K/MW/year so that makes Dogfish revenue in its first year of full operation £9.4M.
I considered that a reasonable assumption so built out the expected revenue model. I noticed how Texas/California assets earn the bulk of earnings during (the hot) summer so applied an 85%/15% to the summer and winter periods (as was the case in y/e 2024). I then applied the revenue forecast assumptions where the Texas (ERCOT) fall by 40% in 2025/2026, where Ireland drops by half in 2026. GB rises by 50% in 2025/2026 (NB I’ve modelled just 20%).

Here are the results. I’ve added in the known Resource Adequacy contract (but further contracts could be possible for Texas also). I’ve assumed a 3 month delay post energisation to revenue commencing and assumed no inflation uplift or reflection of rising energy.

Implications:
Extrapolating energisations and new revenue streams even factoring in forecast revenue rate drops the current 7p a year dividend appears well covered to me.
Consider, too, the above numbers doesn’t include the $60m-$80m US tax credit.
I model Interim period to Interim period (since we are in October now) and from October 2024 the dividend appears to be adequately covered also considering that there are Cash Reserves of some £60m plus further debt headroom (less any capex spent of course).
Valuing the trust on a sustainable dividend basis easily gets you to 100p a share (implying a 7% dividend yield).
Valuing the trust on fair value and on a 15% discount to the 30/06/24 NAV gets you to 90p a share, before consider the uplift arising from the derisking of energised assets, the uplift arising from discount rate unwind, and any kind of potential asset sale.
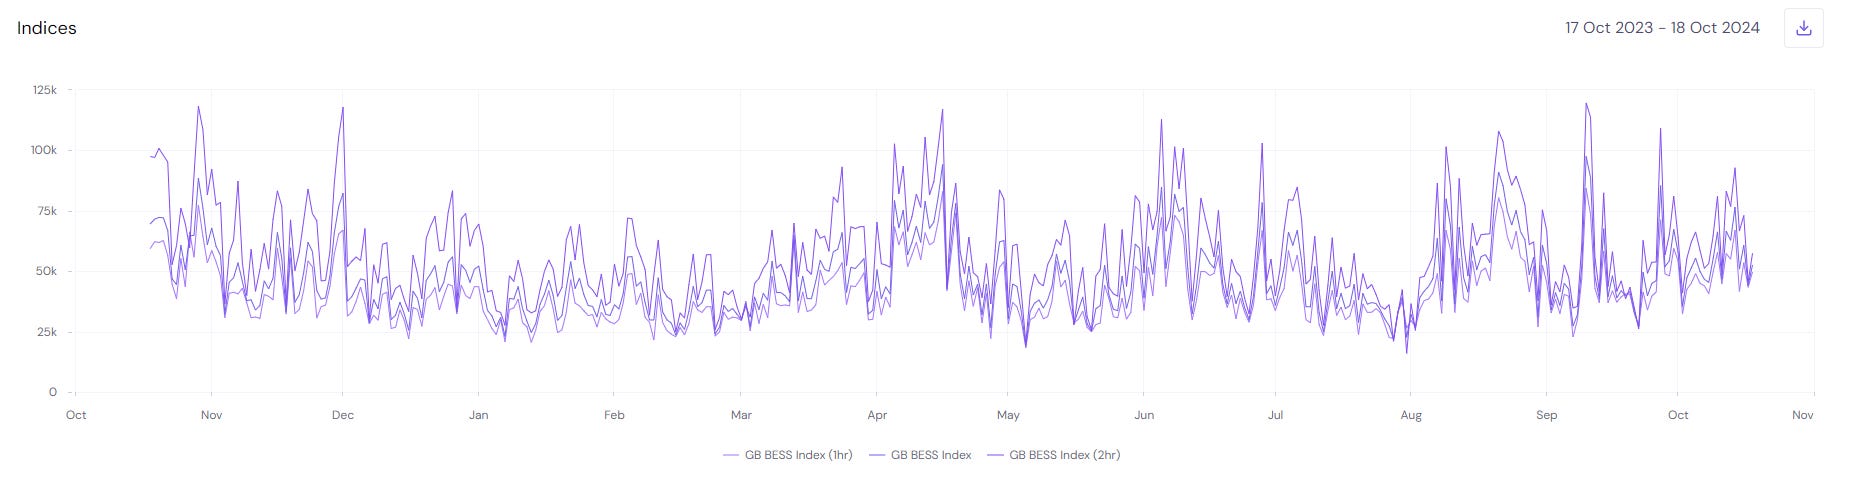
Valuing based on foreseeable prices and events is another matter. I believe there’s also a bull story when you consider the strong penetration of renewables. As is well known, there is a strong yo-yo effect of the variability of renewables. The wind blows then it doesn’t. Solar irradiation is a bit more constant but is seasonal and of course rises and sets plus cloud, temperature and other variables affect the yield. Growing overall demand for electricity also plays a role, but a rapid build out of solar, particularly, is driving that yo-yo creating opportunity for BESS.
Consider the spikes and troughs of the BESS index from Modo Energy. You’ll notice there two three sets of lines - 1 hour, 2 hour and average. Two hour storage can capture spikes more effectively in a way one hour cannot, so doubling a site with longer duration isn’t necessarily a simple doubling of revenue. More on that later.
Also consider that demand for electricity in the US continues to rise. 120b KWh in 2024 and a 50b KWh rise in 2025. An increasing level of renewables grows too - and we see US solar generation doubling in 3 years.

Consider that part of the Yo Yo is negative prices. Sometimes there’s so much energy it goes negative - so a BESS operator gets paid to take that energy. It’s happening more and more often due to renewables. So BESS can acquire energy at a vast profit by reselling at advantageous higher rates but also enjoying a negative cost of sale.
Consider the near doubling of below zero price hours reported in the UK for 2024!

Not only does two hour storage better capture spikes (therefore profits more than double) it is also the case that the marginal Capex cost isn’t equal either. Let’s consider the upside to GSF from investing into efficiency gains and the benefits from upgrading Batteries to a longer 2-hour duration.
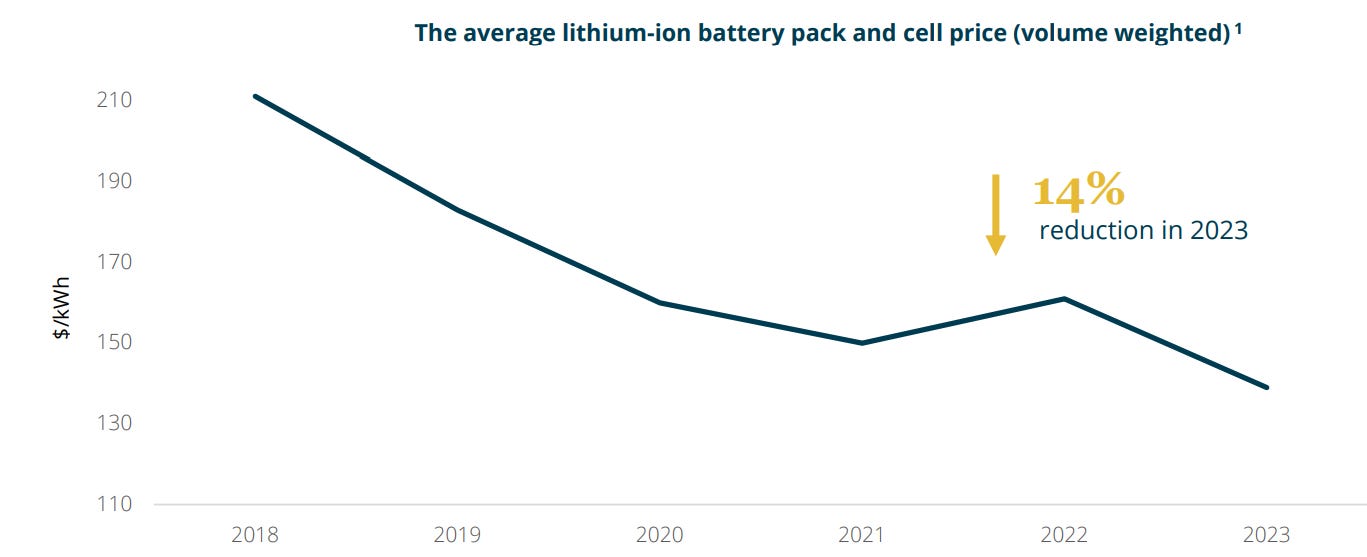
We know the fall in marginal cost in battery packs and cells from 2018 to 2023 has been over 40%. We can therefore deduce the marginal cost of upgrading 1 hour to 2 hour is around ~£100k per MW.
How so?
The US site build out of 275GW of capacity which attracted a 30% tax credit even at the lower $60m figure implies a $60m/0.3 = $200m built cost. Per MW that’s $200m/275mw = $727k or £560k per MW.
We know that ~30% of a BESS build cost is its batteries. £560k is £168k or $218k per MW of batteries.
So effectively converting 1 hour to 2 hour is theoretically an upgrade capex of about 1/6th of the original build if it’s just a battery cost. But let’s assume it’s even 2.5X that number. (fellow BESS operator HEIT speaks to a 25% higher price for 2-hour vs 1-hour)
That’s still doubling capacity with pro rata 60% less capex.
Is that anywhere in the numbers of the above valuation?
Is that OB speculation - or is it factual?
Factual actually. It’s in the 2024 report under “Site Upgrades”.

It’s highly significant that the Ferrymuir 49.9MW, Stony 79.9MW and Enderby 57MW (187MW) of assets are currently being upgraded to a 2 hour duration. That’s 187GW of more capacity. None of the income for that additional 187 GW are in the above numbers reader.
187GW is 25% additional overall GW to the 703.5GW energised as at 31/3/25.
If you convert the entire energised portfolio to 2 hour you double profits…. assuming the pricing remains static which Modo Energy’s graph tells us isn’t true. 2 hour enjoys higher average selling and lower average buying prices.
The Capex at £0.1m/MW - £0.25m/MW is theoretically just £70m - £175m to achieve that too! An IRR of ~30%!

Using the above cash generation numbers it also means I revised my P&L model slightly upwards too, forecasting a growth to 131.6p NAV per share in 18 months time.
NB the June 2024 NAV of 104.4p is the latest NAV which was slightly lower than 107p as at 31/3/24.

Conclusion:
Even after Friday’s price rise, a 7p dividend on a 57p share price represents a 12.3% yield and the target price upside of 100p represents a 75% upside too.
But 100p per share is not an absolute limit.
Upside exists from:
a/ Further resource adequacy contracts, such as for Texas.
b/ Upgrades of capacity from 1 hour to 2 hours driving lower capex and higher revenue through longer duration.
c/ better participation in the UK market’s grid services

d/ participation in the recent UK Long Duration Energy Storage (LDES) scheme and incentives (details still being worked out)
e/ New opportunities in other countries
f/ Further IRA incentives which are almost certain to continue under a Harris Presidency while its total demise and even if so its timing to cease appears exaggerated under a Trump Presidency.
g/ Strong political support in all its other geographies (Germany/Ireland/N.Ireland/UK)
h/ Existing IRA incentives of $60m - $80m.
The current 45.4% discount to current NAV along with the strong dividend which I believe based on the maths is now covered, and with further reasons for upside make this a share for a future feeding frenzy. But Zombies are funny creatures - it’s only when they smell blood that they pounce. Crucially though, on Gore Street, it appears to have a fairly clear timetable until feeding time.
Regards
The Oak Bloke
Disclaimers:
This is not advice
Micro cap and Nano cap holdings might have a higher risk and higher volatility than companies that are traditionally defined as "blue chip".
Early in the video (see link below) Brandt Vermillion, the ERCOT Market Lead at Modo Energy, says batteries are on track for £60K to £70K/MW/year this year (=calendar year I think). ERCOT asset revenue does vary, so GSF might have done a bit better than that?
https://modoenergy.com/research/podcast-ercot-revenue-bess-battery-energy-storage-brandt-vermillion-transmission
Agree with the above, I’ve just been looking into this and UKW, think I will buy a blend of the two. With interest rates expected to fall that should add another tailwind to the share prices, hopefully reducing discount to NAV.