


NESF - is it crackin'?
Next Energy Solar FY25 review


Dear reader,
A reader recently asked why did I value SEIT’s Onyx at 14.5X earnings when NESF is (allegedly) at just 4X earnings. Surely that’s unfair. He had a point. And I didn’t have a ready answer. Until now.
I was determined to find one. Had I got NESF wrong? It was nearly an OB idea for 2025. Was NESF secretly proper tidy? Or was the shine coming off SEIT’s Onyx solar panels?
NESF released its results yesterday. While it had a £99m EBITDA in 2024 and in FY25 announced a lower £94.2m EBITDA (and a £39m EBIT) so on a £404m market cap that’s still 4.1X EBITDA and 10.2X EBIT. Still cheaper. Much cheaper. And an EBIT of £39m implies a -£55.2m depreciation in FY25. But from where are those NESF earnings comprised? Ongoing operations? Or something else?

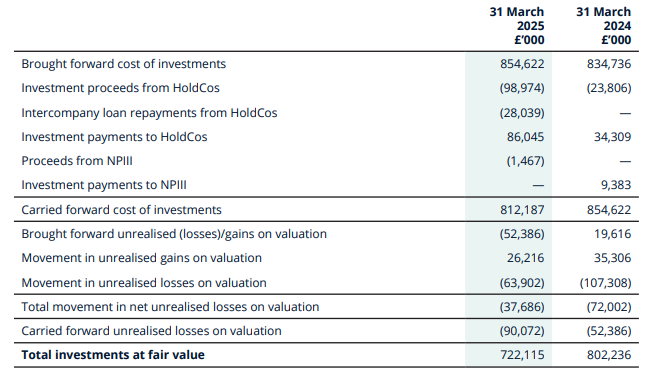
Depreciation is recorded as part of the fair value loss, so -£55.2m of the -£63.9m unrealised losses shown below is presumably depreciation in FY25 - although they don’t specify this.
We see net proceeds to/from HoldCos as a net £12.929m and loan repayments on £28.039m plus £1.467m from NPIII so that’s £42.7m of cash proceeds flowing up to TopCo from HoldCo as we try to decipher the hidden underlying performance.
Underlying “Cash income” is higher where apparent costs of -£7.3m leave £49.2m available…. apparently.

Of course £42.7m of cash proceeds is less than the £56.4m “net cash income available for distribution”.
That’s because Cash Income includes profit on disposal. You can see that in the picture below.

These were the two assets disposed of:

Whitecross delivered a £3.3m gain on disposal and Staughton £5.3m so a £8.6m gain (based on today’s 575,200,043 Shares in Issue) means the portfolio only delivered an underlying Cash Income of £64.6m. That was 86MW of disposals and prior to this 59MW more were disposed. And of course muddled into the FY2025 EBITDA (and EBIT) is that £8.6m gain.
So the true underlying numbers are £85.6m EBITDA (and a £30.4m EBIT).
So “Opex” of -£7.3m doesn’t include Depreciation which is -£55.2m…. of course it is there staring back at you of the P&L in the form of a “Movement in Net Unrealised Losses on Valuation”….. that’s a euphemism isn’t it?
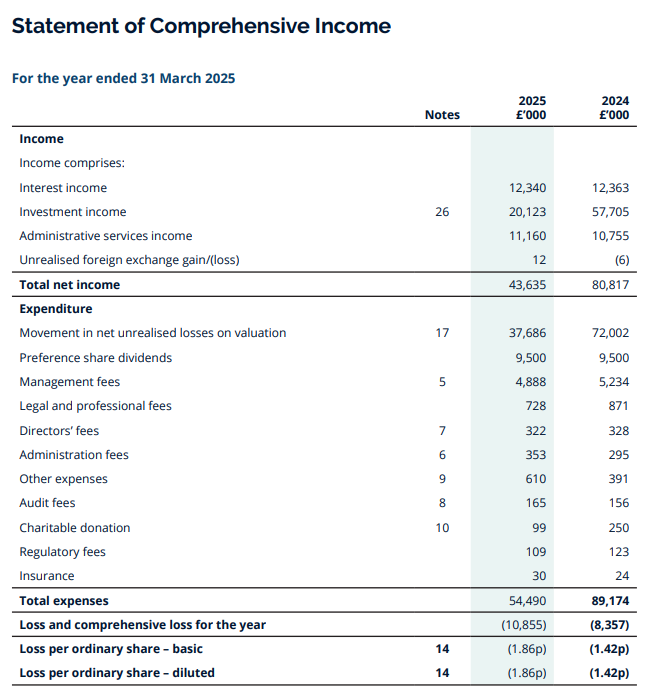
Total Net Income is only £43.635m….. the remainder to get to “Cash Income” is explained below as a loan repayment. Quite how a loan repayment should constitute “Income” makes no sense to me. Robbing Peter to pay Paul. Conversely why does “Net Distributable Cash Generated” not get classified as income?

So EBIT of £30.4m further assumes you are happy to include “Loan Repayments” in that calculation of earnings. If you aren’t then true EBIT is £2.4m isn’t it?
If “DA” is -£55.2m then there’s another -£8.7m of unexplained losses and £26.2m gains in the valuation gains and losses section.

Now of course a gain on disposal of £0.1m per MW gives us a good indication that there’s potential for a further £10m gain given that a further 100MW is being targeted and is - we are told - “in a competitive sales process”.
The NAV is boosted by the sale and by the reduction in the “time value” future cash flows (which are one year nearer). But there are some negatives too.
While there’s potential for £0.1m per MW gain it is notable that remaining assets had to be reduced “Project Actuals -2.4p” and “Revaluation of NextPower III… -0.5p”. That means remaining assets are being reduced in value due to being below expectations - reinforcing the idea that the best assets are being sold leaving the dross behind. 2.9p a share is a -£16.7m hit. Both the assets sold are “Subsidy Free” which of course means they are MODERN assets and modern assets are the best ones (with the highest yields and lowest operating costs) - which is why they get built despite being subsidy free.

Debt grows in cost to -4.9% per annum from -4.5% and considering that 70% of debt is fixed interest that’s actually quite a jump. The -£113.7m and -£33.5m debts amortise over 10 years so equal -£14m of cash outflows per annum.
The RCF and Preference shares represent a further circa -£343m of debt that will require disposals. Using £0.66m as a guide price per MW (this was what was achieved in the recent disposals), paying down that non-amortising debt that would equate to over 500MW of disposals.
But that’s 2/3rds of the portfolio!

NESF Debt:

Am I right to take a hard line on using EBIT not EBITDA?
On Page 40 of NESF’s report they euphemistically refer to “Portfolio Optimisation & Enhancement Activity”
But let’s pick out from that Page 40 what is depreciation by another name. I’ve used BOLD to highlight in the copied text below what is really a depreciation cost and not an enhancement - well judge for yourself:
• Asset repowering: Inverters were replaced at three sites to address systemic defects, restoring availability and improving generation performance. In April 2025, replacement of inverters at two more sites was initiated and is expected to be completed before the summer generating season. In addition, the Company currently anticipates replacing inverters for up to 8 assets (with a combined capacity of up to 80MW) over the next three years.
• Targeted Improvements: A total of 33 improvement plans were completed over the year, to enhance security, asset integrity and system reliability. Key actions included repairs and upgrades to perimeter fencing, CCTV assessments, and structural reinforcements following Storm Darragh. Preventative measures addressed issues such as rodent intrusion, fire risk, corrosion, and equipment degradation.
• Strategic spare parts management: Minimising the impact of component failures across the portfolio through pro-active management and maintenance of the Company’s stock of key spare parts, particularly those with extended lead-times or declining availability.
So Yes, I do believe that ignoring “DA”, in EBITDA - the depreciation and amortisation is foolish. The costs are real and tangible. They are there on Page 40.
Comparing NESF with Onyx (and the rest of SEIT)
NB: I’m giving NESF a free pass on its income includes loan repayments, otherwise SEIT wins hands down.
If I split out the 24% of the SEIT portfolio which is the Onyx component, the “GAV” or gross asset value is the debt plus project equity. The NAV meanwhile is 24% of the overall NAV. I then take the EBITDA. I then calculate the Depreciation and Amortisation. SEIT tell us the remaining life on Onyx is 34 years (per the 2024 annual report) in last year’s annual report so I’m using 33 years (34-1 year). So DA of 3% per year.

I calculate the other SEIT assets at their remaining life. I’ve used the 1H25 results for the EBITDA calculation and DA comes from the GAV divided by the remaining life.
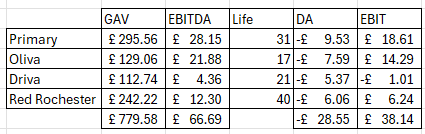
I then realise that there is 19% Construction and Development at SEIT. It is highly likely that this is discounted (since it is earlier stage) but if I assume just a 25% upside (i.e. 19% compared to Operating 76% is a 25% upside) then that’s how I get my “future EBIT” numbers in the above chart for NESF, Onyx and SEIT (ex Onyx).

Then I find Onyx compared with NESF is at a much lower EV/EBIT. 17.5X vs 34X. Nearly half the price!
The non-Onyx parts of SEIT are at a much, much lower valuation. 8.9X vs 34X suggesting that NESF is over 3X more expensive! This is further evidence that the Cash Income for SEIT is also much higher £96m vs £64.6m. (I am excluding extraordinary Cash Proceeds i.e. the gains on asset sales to make this comparison). Bear in mind that the GAV (the Enterprise Value if you will) are roughly the same. The difference is NESF is more heavily geared compared with SEIT.

The concern is shared I see. Mr Head who awards NESF an “Amber” and reaches a similar conclusion: “My concern would be that buybacks and disposals – while mathematically correct – equate to a slow-motion liquidation.”
Yes! We agree on this.
But we do not agree on the yield being “covered” nor would I agree with his (surprising) conclusion that NESF is worth “closer consideration”.
Is it?
“But with NESF trading 25% below book value and offering a covered 12% dividend yield, I think it could still be worth closer consideration for interested investors.”
NESF is a snake eating its tail. Quite quickly. SEIT is nibbling its own tail too in 2025, it’s true. The difference though is that SEIT has stronger and growing cash flows from projects reaching COD, while NESF has heavier levels of debt, a smaller net asset value with much less diversification and faces a cliff edge of reduced subsidy and lower future pricing if its own Power Price curves are accurate.


Once SEIT’s under construction are operational then there’s 25%+ more EBIT (assuming a steady margin) and various projects to achieve upside. SEIT has much lower leverage.
DISCOUNT RATES
A further point to make is consider the discount rates.
SEIT is discounted at a 9.4% discount rate. If SEIT were discounted at the 8% weighted average that NESF is at then it would be worth 15.7p per share more than it is today. (5.6p x 2.8). Quite why a single asset type of solar assets mainly in the UK with a small number in Italy should be valued at such a lower rate seems strange to me. The SEIT portfolio seems much more conservatively valued.


Or looked at another way NESF’s NAV would be -7p per share lower if it had a 9.4% discount rate applied - like SEIT’s. Ouch!

Conclusion
The slight positive I took from NESF’s FY25 full year results were the fact that disposals were achived at a premium to NAV. But isn’t it true that you always sell your best and easiest to sell assets first? The £0.1m per MW average gain isn’t enough to get me excited.
There is a chance that ingestion of one’s own assets to pay the dividend and pay down debt could persist for some time. So the conclusion appears to me that NESF is on borrowed time. Just look at the numbers.
Regards
The Oak Bloke
Disclaimers:
This is not advice - make your own investment decisions.
Micro cap and Nano cap holdings, even those held by a FTSE250 company like NESF or SEIT, might have a higher risk and higher volatility than companies that are traditionally defined as "blue chip"
This is financial engineering at its best or should that be worse as that 179 page annual report seeks to confuse the hell out of me so thanks for picking it apart. Poke around at the operating level and you encounter a labyrinth of companies and holdco's and you'll find at the project level most don't disclose much because they fall below the threshold for small company accounts. The couple of bigger ones that do have full accounts manage to make a loss although as run up the various intermediate levels that that becomes a dividend payment to TopCo.
The whole edifice is built on the ROC/FiT subsidies and once gone it will be toast of course along the way you will have got some reasonable dividends. However, they were greedy and shouldn't have boosted it up after the Ukraine induced power spike and there not the only one to have done that. Long run power prices are falling (well short of Trump piling into the Middle east) and there are two key risks here (i) solar is getting saturated and forcing power prices negative at the time of the day when solar irradiance is at its best (ii) REMA in all likelihood is going to change how pricing works be it zonal or renewables being decoupled from gas either will screw pricing assumptions.
So as you rightly educe this one is eating itself.
Hi OB - Thanks for highlighting the dog out of FGEN, SEIT and NSEF (the last one!)
Judging by the comments this one is attracting. I bought this peak low rates and sitting on 20% loss. Am pretty sure could sell and throw it in GPM and wait till end of the year and would be back in profit.
I'm still reading Nick Sleep letters...
In our opinion, in dealing with mistakes the best state of mind is non-judgmental forgiveness.
Parents will recognise that if their child thinks right, they will make mistakes, work it out for
themselves and learn. They do not need to be judged or punished: instead, they need support,
from themselves and others. If they do learn, then the mistakes are likely to be small compared
to the value of what has been learnt. In investment terms, once lessons have been learnt,
mistakes can be put on a price earnings ratio of one and the resultant, conditioned, good
behaviour on a ratio of more than one. In other words, mistakes become net present value
positive.
Lets hope i learn the lesson of avoiding yield traps. You could argue SEIT might be one but hopefully my judgement here is better. Buying at 45p meant further downside must be limited.